
Time domain analysis TDR/TDT
8-Port 65 GHz
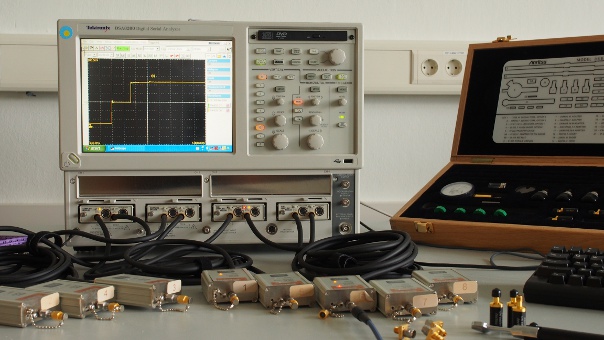
- 40 GB of memory
- Rise time of 12 ps
- TDR/TDT measurments up to 50 GHz
- Bandwidth up to 60 GHz
- Up to 8 channels used at the same time
By using a digital sampling oscilloscope the propagation length and reflection of electromagnetic signals can be determined in time and frequency domain. The time domain analysis is used for serial data networks for telecommunication systems up to data rates of 12 GBit/s. For the design and fabrication of network equipment the proper transmission of digital signals is paramount. By performing time domain analysis exact and reproducible results are obtained through straightforward and inexpensive measurements in limited time. Also high frequency signals at connectors can be investigated as well as crosstalk in multilayer printed circuit boards with multiple through connections. The measurement routines for the analysis of TDR/TDT for the devices under test can be executed in a few minutes because no calibration of the already connected measurement modules is necessary prior to the measurement.
The broadband TDR measurement is used for the determination of transmission lines, their terminations, and networks. This is done by sending a digital signal into the device under test and measuring the reflected signals. Only the initial impulse of the sent signal and the subsequent step response of the reflected signal are considered. Both signals are added up and observed in a temporal window. In order to determine differential crosstalk in a transmission lines, the TDR signal is injected into one of the lines and a second module is used to measure the signals at the second differential line. The device under test can be connected to the two port remote sampler using a coaxial connector. With no required calibration the measurement can be completed in a fast and exact manner. Special single ended TDR probes can be used for high quality measurements of impedances on printed circuit boards. They are indispensable for the measurement of small electrical components.
Digital Storage Oscilloscope
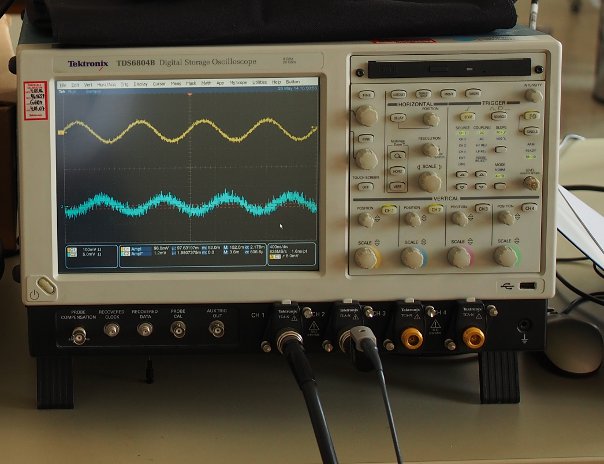
(Source: TET, TUHH)
- 20 GSa/s Real-time sample rate
- Buffering 32 MSa/s
- Serial data analysis at rate 6 Gbit/s
- Bandwidth 8 GHz
- 4 independent inputs channelse
- Rise time to 19 ps
The digital storage oscilloscope (DSO) samples the measurement voltage and displays it as a curve with respect to time. Up to four different signals can be picked up, displayed, compared, and evaluated simultaneously. The simultaneous display of synchronous measurement signals allows for a fast and accurate survey of recurring and transient interfering impulses in the setting of crosstalk within a bus. Moreover, results may be displayed and stored prior to triggering.
The DSO is used mostly for experimental set-ups for research and development of challenges of computer and telecommunication industry. In this regard, it is an essential tool and provides a variety of measurement data that is of interest to the researcher. Low and high frequency signals on printed circuit boards and connectors can be measured and verified even at low levels.
A variety of settings and aspects is to be considered for qualified measurements. These include attenuation and amplification at the input, time basis, and a useful triggering. Tiny probes are required for a characterization of packed elements and conductive paths. These probes as well as connecting cables must match the settings and requirements of the DSO.
A calibration is mandatory prior to any measurement. A compensation of the probe can be done using the reference signal available from the front terminal. It is mandatory to wear a wristband for electrically grounding the user to prevent possible damage due to electrostatic discharge. Equivalent measures may be used.
Periodic signals are triggered and traced statically on the display of the DSO. Different triggering functions allow for an acquisition of periodic as well as transient signals. Triggering a slope is a basic function that is used very often. The X/Y-setting allows for displaying of characteristic curves and transfer functions of elements under test. All data may be stored digitally for a subsequent processing.